How to Build a Data-Driven Amazon Scaling System
Suppose one of your Amazon products shows a 24% ACoS, stable traffic, and a growing number of ad-attributed orders. The PPC dashboard looks healthy, so increasing bids and budget appears to be the obvious next step.
Then you check the rest of the account.
A coupon has reduced contribution margin. Non-branded conversion has fallen. Most of the recent sales came from your own brand name, and the product has less than three weeks of inventory remaining. PPC performance looks efficient, but the ASIN is not ready to scale.
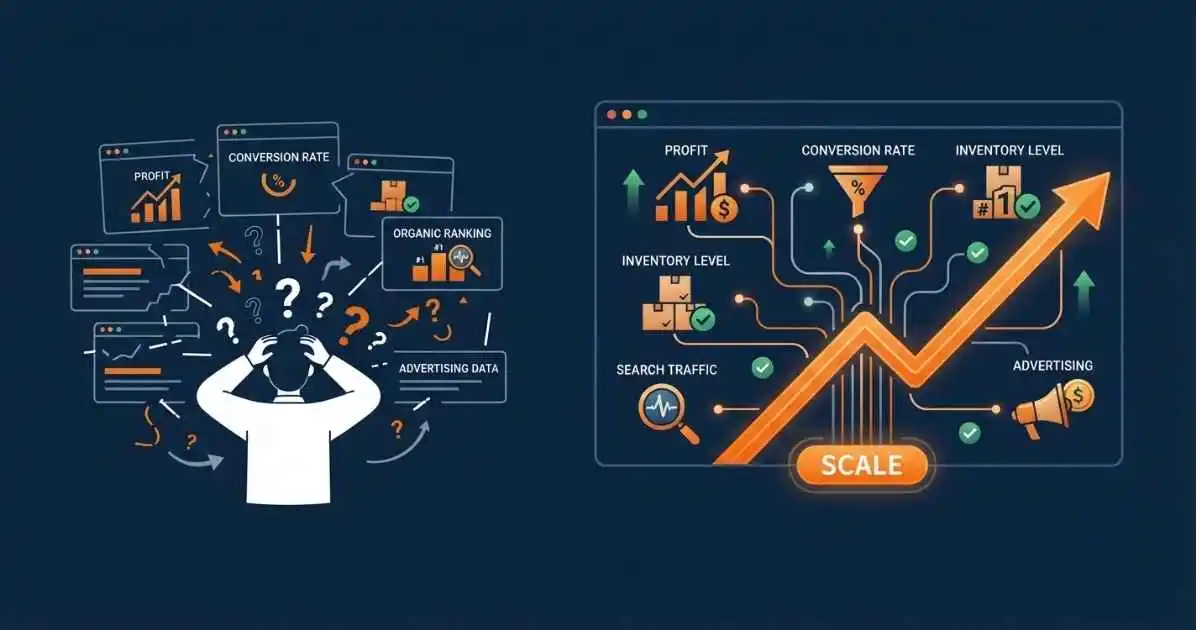
This is where many Amazon growth decisions go wrong. Sellers treat one positive metric as permission to spend more without checking whether profit, conversion, organic visibility, and inventory support the same decision.
Data-driven Amazon scaling means connecting those signals before deciding what to increase, protect, fix, or stop. A tool can collect reports and execute changes, but the quality of the decision depends on whether you are using the right data in the right order.
At ScaleA2Z, AI-assisted analysis and third-party tools support human-led PPC and account management. The objective is not to generate more dashboard activity. It is to identify the constraint limiting profitable growth and make the next decision around that constraint.
If several parts of your account are affecting each other, full account management can connect PPC performance with listings, inventory, pricing, and profitability instead of treating each one as a separate problem.
Is Your ASIN Actually Ready to Scale?
Don't burn capital on deceivingly low ACoS metrics. Get a complete, connected audit of your PPC, unit margins, and inventory capacity from our senior growth team.
Request an Account Scaling AuditTable of Contents
Why Amazon Scaling Decisions Need More Than One Data Layer
A single metric can accurately describe one part of your Amazon account without proving that the product is ready to scale. ACoS may show advertising efficiency, but the final decision also depends on margin, traffic quality, listing conversion, organic visibility, and inventory capacity.
Use a Decision Chain Instead of a Metric Scorecard
Do not classify individual metrics as green or red and scale whichever campaign has the most positive numbers. Connect each signal to the next business layer.
| Scaling Decision | First Signal | Required Confirmation | Reason to Delay |
|---|---|---|---|
| Increase campaign budget | Stable advertising efficiency | Contribution profit and incremental demand | Sales are mostly branded or margin is weak |
| Expand non-branded targeting | Relevant search-term conversions | Listing conversion and inventory capacity | Traffic converts poorly or stock is limited |
| Scale an ASIN | Stable traffic and conversion | Profitability, organic visibility, and days of cover | Growth would create a stockout |
| Increase placement bids | Strong placement conversion | Incremental sales and acceptable CPC | Placement sales replace existing demand |
| Support a launch | Relevant impressions and clicks | Defined launch budget and measurement window | No clear limit on acceptable loss |
The correct scaling decision appears only when the relevant layers support the same direction.
Quick Tip: Ask which business condition could invalidate a positive metric before increasing spend.
What Data-Driven Amazon Scaling Actually Means
Being data-driven does not mean collecting every report available in Seller Central. It means choosing the evidence needed for a specific decision and understanding what each source can and cannot prove.
A useful scaling process answers five questions:
- What outcome are you trying to improve?
- What is currently limiting that outcome?
- Which data confirms the constraint?
- What controlled action addresses it?
- Which result will show whether the action worked?
The report is not the decision. It is evidence used to make the decision.
The Core Data Sources Behind Amazon Scaling Decisions
Amazon’s Sponsored Products search-term report shows the customer search terms that generated at least one advertising click. Seller Central Business Reports provide listing-level traffic and order data, while Brand Analytics adds broader query and search-funnel information for eligible brand owners.
Your margin and inventory data complete the picture because Amazon advertising reports cannot independently show whether additional sales will remain profitable or whether the product can support higher demand.
Each source answers a different question. The five data layers below show how to review them in the order required for a scaling decision.
Most scaling decisions require more than one row from this table. Advertising data may tell you where spend is going, while conversion, margin, and inventory data tell you whether increasing that spend is sensible.
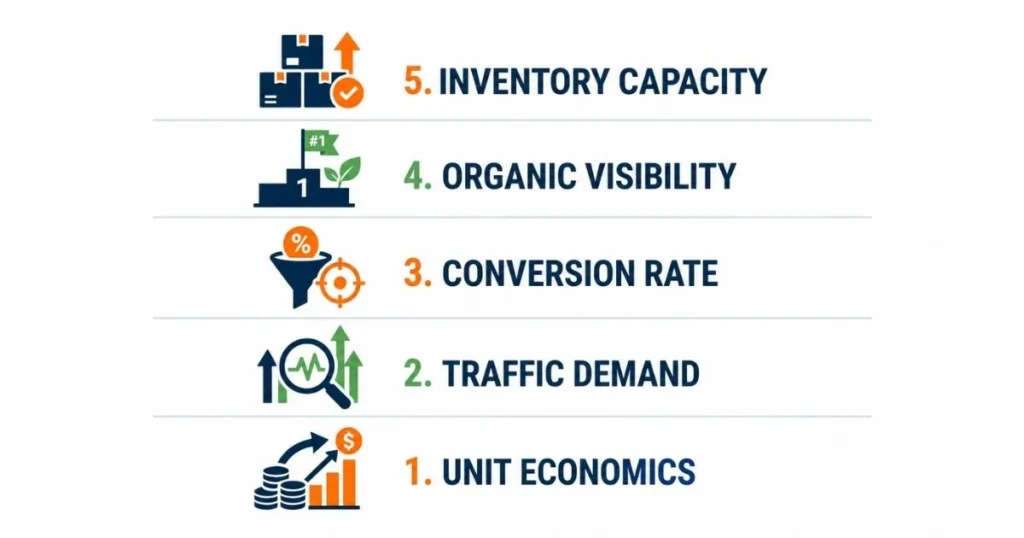
The Five Data Layers Behind Amazon Scaling
A scaling decision becomes stronger when you review information in a fixed order. Start with unit economics, then review demand quality, listing conversion, organic visibility, and operational capacity.
This order prevents a positive advertising metric, such as a low campaign ACoS, from overruling a more important constraint like weak contribution margin or limited inventory.
1. Unit Economics and Profit Capacity
Before increasing spend, calculate what each major ASIN can afford.
Review:
- Selling price after coupons and promotions
- Referral and fulfilment fees
- Cost of goods
- Freight and preparation costs
- Expected returns or refund costs
- Contribution margin before advertising
- Break-even ACoS
- Profit per order after advertising
A campaign can show a 20% ACoS and still lose money when the product has less than 20% contribution margin before advertising.
The reverse can also be true. A higher ACoS may be acceptable for a defined period when the product has sufficient margin, inventory, and a clear non-branded growth objective. The metric is not automatically good or bad. Its value depends on the economics and role of the product.
2. Demand and Traffic Quality
Traffic growth is useful only when it comes from relevant shoppers.
Review:
- Search impressions
- Detail-page sessions
- Click-through rate
- Search terms
- Branded versus non-branded traffic
- Placement mix
- Query-level click share
- Category demand direction
If impressions are increasing but clicks remain flat, the offer or main image may not be competitive. If clicks increase but purchases do not, traffic relevance or listing conversion deserves attention before bids are raised again.
Search-term reports can identify the customer searches that produced ad clicks, which makes them useful for separating relevant demand from expensive traffic that does not support the listing. Our search term mining SOP breaks this process down step by step if you want to go deeper on this layer alone.
3. Listing Conversion Strength
Increasing traffic to a weak listing normally increases cost faster than sales.
Review:
- Unit Session Percentage, which compares ordered units with listing sessions
- Ordered units
- Price and coupon changes
- Main-image competitiveness
- Review count and rating movement
- Variation availability
- Delivery promise
- Buy Box or Featured Offer status
- Changes to bullets, A+ Content or product images
Do not assume an advertising metric is an advertising problem. A rising ACoS can result from lower conversion even when CPC and search-term quality remain stable.
When conversion falls, compare the timing with listing edits, price changes, review movement, competitor actions, and inventory availability.
4. Organic Visibility and Incremental Growth
Advertising should be evaluated alongside total and organic performance, not only attributed to PPC sales.
Review:
- Total sales direction
- Estimated organic-sales direction, interpreted alongside total sales, ad-attributed sales, and their reporting windows
- TACoS trend, which compares ad spend with total sales
- Organic keyword visibility
- Search Query Performance
- Branded versus non-branded orders
- New query coverage
- Competitor presence
Eligible brand owners can use Amazon’s Search Query Performance dashboard to identify which customer queries led shoppers toward their products and review performance across different stages of the search funnel.
A low ACoS driven mainly by branded traffic may protect existing demand without creating much incremental growth. That does not automatically make branded advertising unnecessary, but it means the campaign should not be treated as proof that the ASIN is successfully expanding into new demand.
The more useful scaling question is:
Are additional advertising dollars producing more total profit, stronger non-branded reach, or better organic visibility?
When paid traffic grows, but organic visibility does not, review the Amazon SEO mistakes that weaken rankings before assuming that higher bids are the next answer.
5. Inventory and Operational Capacity
Growth is not sustainable when the business cannot fulfil the demand it creates.
Review:
- Available inventory
- Average daily sales
- Days of cover
- Production and shipping lead time
- Inbound inventory status
- Stockout risk
An ASIN with strong conversion and acceptable ACoS may still be the wrong product to scale when available inventory cannot cover the replenishment period.
Before increasing demand, estimate whether the product can remain available until replacement inventory is received. A short-term sales increase followed by a stockout can disrupt advertising, organic visibility, and customer choice.
How to Know Whether Your Data Is Decision-Ready
Having data does not automatically make the data reliable enough for action. Before making a scaling decision, check whether the evidence is current, sufficiently segmented, and matched to the correct business question.
Why Amazon Metrics From Different Reports Do Not Always Match
Amazon reports can use different scopes, attribution rules, and stages of the shopping funnel. Similar metric names therefore do not always represent the same customer activity.
Amazon Ads reports focus on advertising interactions and attributed outcomes. Business Reports examine detail-page sessions and ordered units. Search Query Performance covers how eligible brand and ASIN queries move through the Amazon search funnel. Do not assume that clicks, purchases, conversion rates, or sales from separate dashboards should match exactly.
Before comparing two reports, confirm the following:
- What customer action each metric measures
- Whether it covers paid, organic, or combined activity
- Which attribution or reporting window applies
- Whether the data is brand-, ASIN-, campaign-, or query-level
- Whether the reports cover the same dates
Use the reports together for diagnosis, but do not combine or subtract their numbers without first checking these differences.
Match the Time Window to the Decision
A short window may help identify sudden changes, but it can be too noisy for a major scaling decision.
Use shorter windows for:
- Stockouts
- Suppressed offers
- Sudden CPC increases
- Unexpected conversion drops
- Promotion-related anomalies
Use longer and comparable windows for:
- Bid and budget expansion
- Margin trends
- Organic growth
- Seasonal performance
- Category demand changes
Always compare similar periods and note promotions, price changes, holidays, or inventory interruptions that make one period different from another.
Segment Before You Average
Account-level averages often hide the product or traffic source causing the issue.
Segment by:
- ASIN
- Search term
- Branded versus non-branded traffic
- Placement
- Match type
- Campaign purpose
- Product stage
- Margin level
- Inventory risk
A blended account ACoS may look stable while one profitable product is improving and another is consuming most of the budget without producing incremental sales.
Avoid Acting on Thin Data
There is no single click or order threshold that works for every ASIN. Data requirements depend on product price, conversion rate, sales velocity, margin, and the size of the decision.
A small bid test needs less evidence than doubling a product’s budget or applying the same scaling decision across the entire catalog.
When data is limited:
- Make smaller changes
- Use a longer observation window
- Avoid permanent conclusions
- Record the uncertainty
- Set a specific review date
Quick Tip: The lower your confidence in the data, the smaller and more reversible the next action should be.
How to Find the Real Constraint Blocking Growth
Do not begin by asking which metric needs optimization. Begin by asking which constraint is preventing the desired outcome.
| Symptom | Data to Compare | Likely Constraint | First Action to Investigate |
|---|---|---|---|
| Traffic is growing, sales are flat | Sessions, CTR, Unit Session Percentage and price | Conversion | Review listing, price, reviews and offer |
| PPC sales are growing, total sales are flat | Ad sales, organic sales, TACoS and branded share | Limited incremental growth | Separate branded and non-branded contribution |
| ACoS is rising after CPC stays stable | Conversion, price, reviews and inventory | Listing or offer | Find what changed on or around the listing |
| ACoS is low, but profit is weak | Contribution margin, coupons, fees and returns | Unit economics | Recalculate break-even targets |
| Strong conversion, limited impressions | Query visibility, bids, relevance and category demand | Reach | Expand qualified search and placement coverage |
| Sales are rising faster than expected | Sales velocity, lead time and days of cover | Inventory | Protect stock before increasing demand |
| One ASIN grows while the account remains flat | SKU-level sales, spend and margin | Budget allocation | Shift resources toward validated opportunities |
This diagnostic sequence stops you from treating every Amazon growth problem as a bid problem.

The Six-Step Amazon Scaling Decision Framework
Use the following process whenever you are deciding whether to increase spend, expand targeting, change a listing, or scale an ASIN.
Step 1: Define the Business Outcome
Choose one primary result:
- Increase profit dollars
- Grow non-branded sales
- Improve organic visibility
- Launch a new product
- Protect market share
- Reduce wasted spend
- Build sales without creating inventory risk
Do not try to optimize every metric at the same time.
Step 2: Identify the Constraint
Use account evidence to determine what is currently preventing the outcome.
The constraint may be:
- Insufficient demand
- Weak click-through rate
- Low conversion
- Poor unit economics
- Limited qualified traffic
- Inventory risk
- Weak organic visibility
- Inefficient budget allocation
Step 3: Choose Leading and Lagging Metrics
Leading metrics show whether the action is moving in the intended direction before the full business outcome appears. Lagging metrics show whether the action produced the final result.
Example:
| Goal | Leading Metrics | Lagging Metrics |
|---|---|---|
| Grow non-branded sales | Generic impressions, clicks, qualified search terms and conversion | Non-branded orders, total sales, profit and organic visibility |
| Improve profitability | CPC, conversion and wasted spend | Contribution margin and profit dollars |
| Scale an ASIN | Sessions, conversion, query coverage and inventory capacity | Total sales, TACoS, profit and organic rank |
| Improve listing conversion | CTR, Unit Session Percentage and cart activity | Orders, profit per session and advertising efficiency |
Step 4: Make One Controlled Change
Examples include:
- Increase one qualified campaign budget
- Improve the main image
- Adjust price or coupon
- Expand one search-term group
- Reallocate spend between ASINs
- Reduce low-relevance traffic
- Protect inventory by limiting demand
Avoid changing bids, price, images, promotion, and campaign structure at the same time. Multiple simultaneous changes make it difficult to identify what caused the result.
Step 5: Set the Measurement Window
Define:
- The date of the change
- The metrics to review
- The expected direction
- The minimum evidence needed
- The review date
- The condition for reversing or expanding the action
Step 6: Record What the Account Learned
Maintain a simple decision log with the following:
- The problem observed
- The diagnosis
- The data used
- The action taken
- The result
- The next decision
This prevents the team from repeating failed tests or relying on memory when the same problem appears again.
A Low-ACoS ASIN That Should Not Be Scaled
Suppose a kitchen-storage product has the following results:
- ACoS: 21%
- Break-even ACoS: 32%
- Conversion rate: stable
- Ad sales: increasing
- Total sales: increasing
- Inventory: 18 days of cover
- Replenishment lead time: 40 days
Advertising performance suggests the ASIN can support more spending. Inventory data gives the opposite answer.
Increasing bids may generate profitable orders for several days, but it also increases the probability of a stockout before new inventory arrives. The correct scaling decision is not to increase spend immediately.
A data-led response would be:
- Protect high-value and branded traffic.
- Reduce expansion into lower-priority queries.
- Confirm the inbound inventory timeline.
- Recalculate safe daily sales velocity.
- Increase spend after the stock position supports it.
The low ACoS was accurate. It was simply not the most important constraint.
Which Metrics Matter at Each Amazon Growth Stage?
The same metric can carry different weights depending on the product stage.
| Growth Stage | Primary Questions | Priority Signals |
|---|---|---|
| Launch | Are relevant shoppers finding and buying the product? | Indexing, search terms, impressions, CTR, conversion, non-branded orders and inventory runway |
| Stabilization | Can the product convert and sell within sustainable economics? | Unit Session Percentage, break-even ACoS, contribution margin, wasted spend and keyword quality |
| Scaling | Can more demand produce incremental profit without operational damage? | Total sales, profit dollars, TACoS direction, query coverage, organic visibility and days of cover |
| Defense | Can the brand protect profitable demand and market position? | Branded efficiency, competitor presence, query share, organic rank, repeat demand and inventory |
For a time-based version of this process, our 90-day Amazon growth plan shows how account auditing, listing readiness, campaign cleanup, and controlled scaling should happen in sequence.
How to Measure Incremental Growth, Not Dashboard Activity
Incremental growth means the change created additional business value rather than moving existing orders into an advertising report. Measure it by comparing total sales, contribution profit, non-branded demand, organic visibility, and inventory impact before and after a controlled change.
| After the Change | Likely Interpretation |
|---|---|
| Ad sales and total sales both increase while contribution profit holds | The change may be creating useful additional demand |
| Ad sales increase but total sales remain flat | Paid activity may be replacing existing sales |
| Spend rises while TACoS falls and profit increases | Advertising may be supporting broader business growth |
| ACoS improves but total profit declines | Lower advertising cost is not solving the main business problem |
| Sales grow, but inventory falls below safe cover | The result is profitable in the short term but operationally unsustainable |
| Non-branded orders and organic visibility improve together | The product may be reaching demand beyond existing brand searches |
No single pattern proves incrementality by itself. Promotions, price changes, competitor stockouts, seasonality, and reporting delays can influence the result.
That is why every scaling test should have:
- A documented baseline
- One controlled change
- A defined measurement window
- A comparison period
- A profit and inventory check
- A decision to expand, hold, or reverse
The objective is not to prove that the dashboard changed. It is to determine whether the business gained something it would not otherwise have captured.

Where Tools Fit After the Data System Is Built
Tools are most useful after the goal, metric definitions, guardrails, and review process have already been established.
They can support:
- Data collection
- Reporting
- Alerts
- Change logs
- Repetitive bid execution
- Budget pacing
- Search-term organization
- Anomaly detection
They are most useful when they apply an already validated decision rule. The scaling strategy should still come from connected profitability, conversion, demand, organic visibility, and inventory data.
They should not become the main subject of this article. Once the decision rules are clear, our guide to manual PPC versus automation tools can help you decide which tasks need human judgment and which repetitive actions software can handle.
Amazon Scaling Readiness Checklist
Before increasing bids, budgets, or traffic, confirm that the product meets the conditions below.
- Contribution margin and break-even ACoS reflect current costs, fees, prices, and promotions.
- Traffic is relevant and branded performance is separated from non-branded demand.
- Listing conversion is stable enough to support additional sessions.
- Reporting windows and metric definitions are aligned.
- Inventory can cover the expected sales velocity and replenishment lead time.
- The test has a documented baseline, one controlled change, and a review date.
- Success will be measured through total profit and business growth, not only ad-attributed sales.
If one of these conditions is missing, reduce the size of the test or fix the constraint before scaling.
How ScaleA2Z Uses Data to Support Amazon Scaling
ScaleA2Z connects PPC performance with the business signals that determine whether growth is profitable and sustainable.
The review process may include:
- SKU-level margin and break-even targets
- Search-term and placement performance
- Listing traffic and conversion
- Branded versus non-branded sales
- Organic visibility
- Inventory risk
- Pricing and promotion changes
- Campaign and account-level profitability
AI-assisted analysis and third-party platforms such as Scale Insights can support monitoring, reporting, bid adjustments, and repetitive campaign work. A human strategist still defines the objective, interprets the account context, and decides when a recommendation should be accepted, modified, delayed, or rejected.
This matters because PPC rarely operates independently. A conversion decline can make efficient keywords look unprofitable. A stock constraint can make growth risky. A margin change can make an old ACoS target inaccurate. Across accounts we’ve reviewed, the most common pattern isn’t a broken campaign. It’s a target ACoS that was never updated after a cost or price change, which quietly turns a “good” metric into a bad decision.
ScaleA2Z’s Amazon Ads Management connects routine campaign execution with these broader account decisions instead of judging performance through one dashboard metric.
Final Takeaway
Data does not replace tools, and tools do not replace analysis.
Data-driven Amazon scaling begins by defining the business outcome, identifying the constraint, and connecting advertising performance with profitability, conversion, organic visibility, and inventory.
Only after those signals support the same direction should you increase bids, expand budgets, or push more traffic toward an ASIN.
A strong tool can make the approved action faster and more consistent. It cannot make incomplete evidence complete or turn the wrong growth target into the right one.
Before scaling, ask one question:
What does the full account data say should grow next, and what could prevent that growth from becoming profitable?
For a connected review of your PPC, listing, profitability, and operational data, ScaleA2Z’s full account management team can help identify the constraint that needs attention before more budget is committed.
This framework reflects how ScaleA2Z’s account management team reviews Amazon accounts before approving a scaling decision, built from patterns observed across PPC and full account management engagements.
Frequently Asked Questions
What is data-driven Amazon scaling?
Data-driven Amazon scaling means increasing sales, spend, visibility, or inventory only after relevant business data supports the decision. It connects advertising performance with profit, listing conversion, organic visibility, customer demand, and inventory rather than relying on one dashboard metric.
Which data should you check before scaling an Amazon product?
Start with contribution margin, break-even ACoS, sessions, Unit Session Percentage, search-term performance, branded versus non-branded sales, organic visibility, and inventory days of cover. The exact priority depends on whether your goal is profit, launch visibility, market share, or total sales growth.
Can a product with a low ACoS still be a poor scaling opportunity?
Yes. A low ACoS does not account for product costs, fees, discounts, organic cannibalization, weak non-branded growth, or inventory risk. The campaign may be efficient while the broader business case for increasing spend remains weak.
How do you know whether an Amazon ASIN is ready to scale?
An ASIN is more likely to be ready when it has relevant demand, stable conversion, updated unit economics, sufficient margin, enough inventory, and evidence that additional traffic can create incremental sales. Scaling should begin with a controlled increase rather than an immediate account-wide change.
Should you focus on ACoS, TACoS, or profit?
Use ACoS to evaluate attributed advertising efficiency, TACoS to understand advertising spend relative to total sales, and contribution profit to assess the actual business outcome. None should be used alone. The correct priority depends on the product stage and growth objective.
How much Amazon data is enough to make a scaling decision?
There is no universal minimum. A high-volume product may produce useful evidence quickly, while a low-volume ASIN needs a longer window. The size and reversibility of the decision should match your confidence in the data. Larger budget increases require stronger evidence than small tests.